Audience research provides us with essential information about our audiences; for several years the University of Cambridge Museums (UCM) have been collecting demographic and travel information for our visitors.
This is important and informs a lot of what we do and how we market it. But to add balance to the picture of our audiences, we have also been recording not just who is visiting, but what they do within our spaces, what their behaviour is.
This project began in 2013 and drew to a close at the end of March 2018. After 15 separate assignments in 7 venues we have found out some interesting things about how visitors use our spaces. For 302 hours, our team of 37 trained volunteers observed 1589 people. The team timed over 16500 stops made by those visitors.
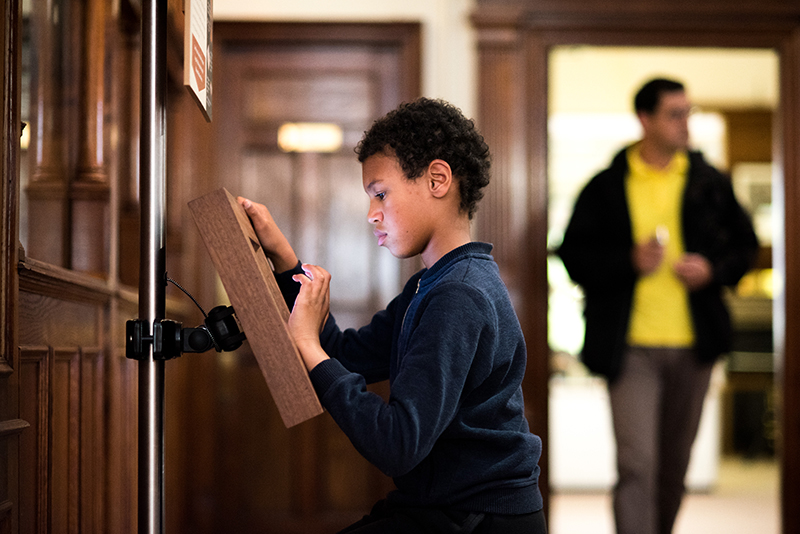
It has not been a high-tech project: we have used photocopied gallery plans on paper, and the volunteer has a stopwatch and a pencil. A sampling system is used, when the visitor enters a gallery they are unobtrusively observed, with the location and time of the stop recorded on the plan. The volunteer also notes any other relevant behaviour, such as calling someone else over or photographing a case.
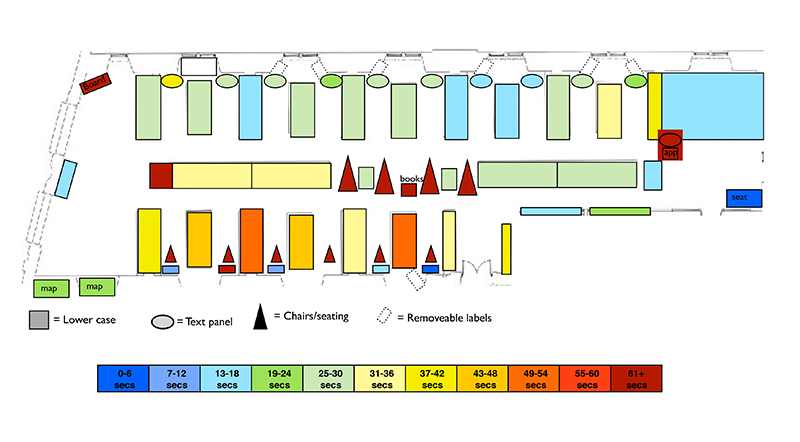
The data is entered into a spreadsheet, and all the results are used to create thermal plans showing which parts of the gallery visitors stopped at, which objects, cases or text were popular and which parts were ignored. We can also tell what route visitors took through a gallery and the average time spent.
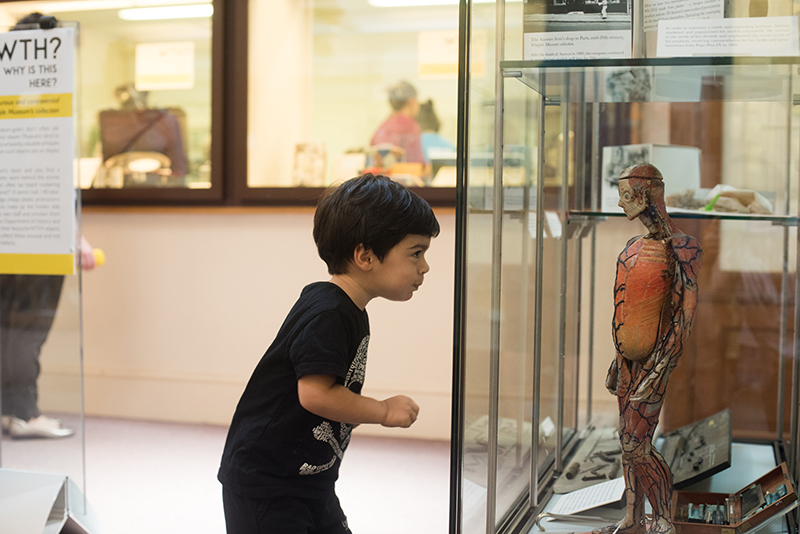
So, what have we learned? Visitors are unpredictable, they rarely do what you would like them to. They visit exhibitions backwards, forwards, starting halfway, barely or completely. Visitors don’t read text panels in the order they have been designed in. They often read the introductory text last. In fact, they might not even read text panels at all. Because one thing the tracking does show is that visitors really like looking at objects.
On average, across all spaces, two thirds of visit time was spent looking at displays, with one third spent moving around the space and enjoying the atmosphere in the museums. Only 4% of display items in museums were not looked at by any visitors. Coffins, meanwhile, proved to be very engaging. The most stopped-at display element in any of the museums was a mummy coffin in the Death on the Nile exhibition at the Fitzwilliam Museum in 2016, which 88% of visitors looked at. The most popular element in a permanent gallery is the Arbury coffin at the Museum of Archaeology and Anthropology, which 76% of people visited.
While the tracking results have been interesting and useful to individual venues, the results have been used in various other ways. The evidence from gallery evaluation has been used in funding applications, or as final reports to funding bodies. Some venues have used the final reports in a formative way, prior to creating displays, both permanent and temporary. The results have helped influence text writing and interpretation.
Perhaps more interestingly, the data can help us to tease out areas in venues which are not engaged with, and think about how we can encourage visitors to get into those places. We can look at the locations of text panels, labels and photos, and see what draws visitors into corners or spaces that might be less frequently engaged with.
This project has not discovered everything there is to know about the visitor experience. I am still intrigued as to why one visitor spends 64 seconds at a case and another walks past without a glance. I am not entirely sure why one venue can have 16% of elements unvisited, while in five studies everything was stopped at least once. We don’t have all the answers, but we have at least begun to understand people a little better. The strength of the project has come from this being one of a suite of tools from UCM, used not in isolation, but in conjunction with our other evaluation methods. Overall, this project has been a testament to the dedication of the volunteer team, who have been brilliant throughout. Thanks are also due to the front of house teams in the venues we have tracked in, who have encapsulated a combination of patience with me and wisdom about the visitor experience. Even if the project has ended and I have hung up my stop watch, I know that I will somehow not be able to stop people-watching in galleries, wondering which painting is visited the most and whether anyone visits that little gem of an object in the corner of the gallery.
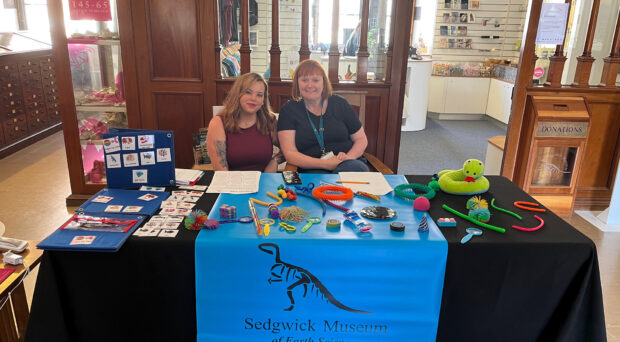
You can find out more about the project on this blog, including the use of meaning maps to evaluate a temporary exhibition and gallery evaluation in the Sedgwick Museum.