How can we measure the impact of an exhibition? Having spent a few years tracking visitors in our gallery spaces, we have started using personal meaning mapping to deepen our understanding of the knowledge people take from exhibitions. Find out how the University of Cambridge Museums are using this technique and its results.
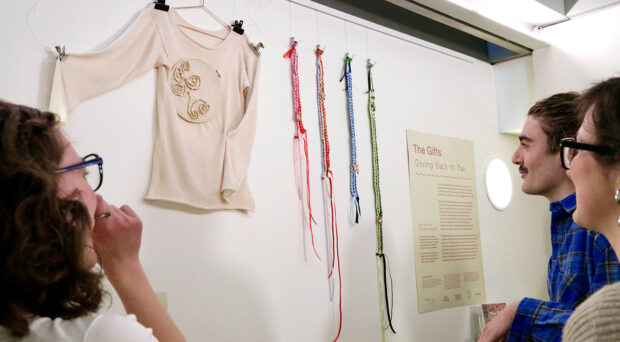
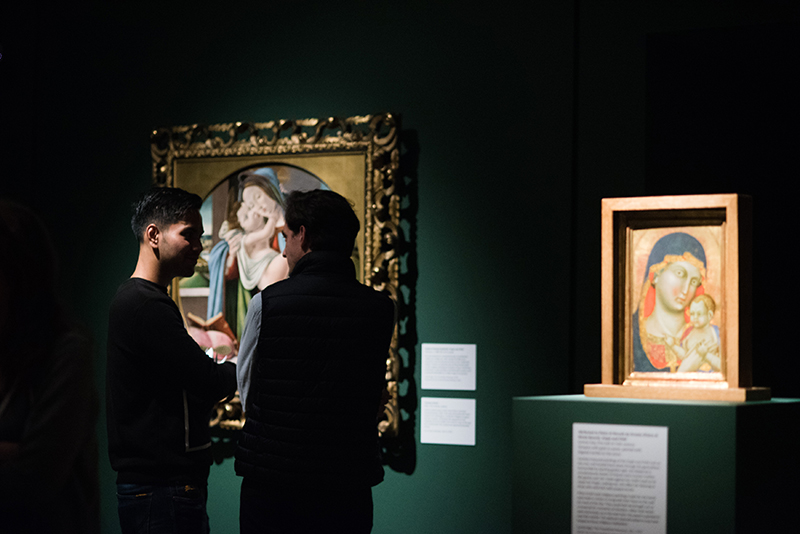
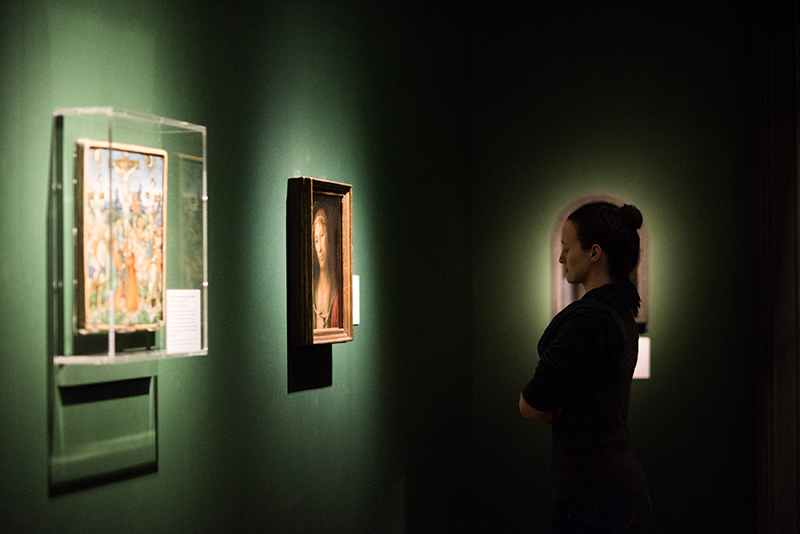
Over the last 5 years we have been evaluating gallery spaces across the University of Cambridge Museums (UCM). We have been unobtrusively tracking visitors, creating thermal maps, and complementing this with guided questionnaires with visitors. Last year we did some evaluation work for the Fitzwilliam Museum for their special exhibition Madonnas and Miracles: The Holy Home in Renaissance Italy. This exhibition was the culmination of a European-funded research project by four sections of the University: the Italian Department, and the Faculties of History, Architecture and History of Art.
Because the exhibition was so closely linked to the research, we wanted to look at the impact the research had in the visitor. While there were many methods to evaluate visitor perceptions, we decided to use personal meaning mapping.
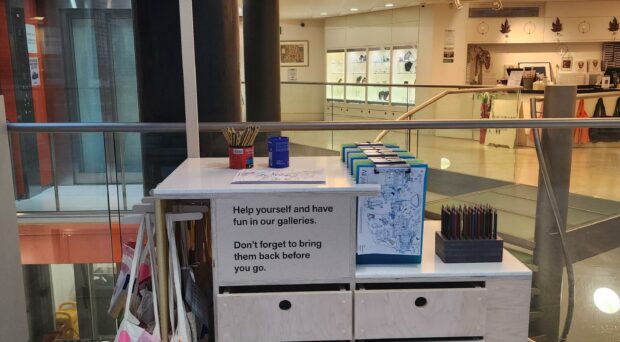
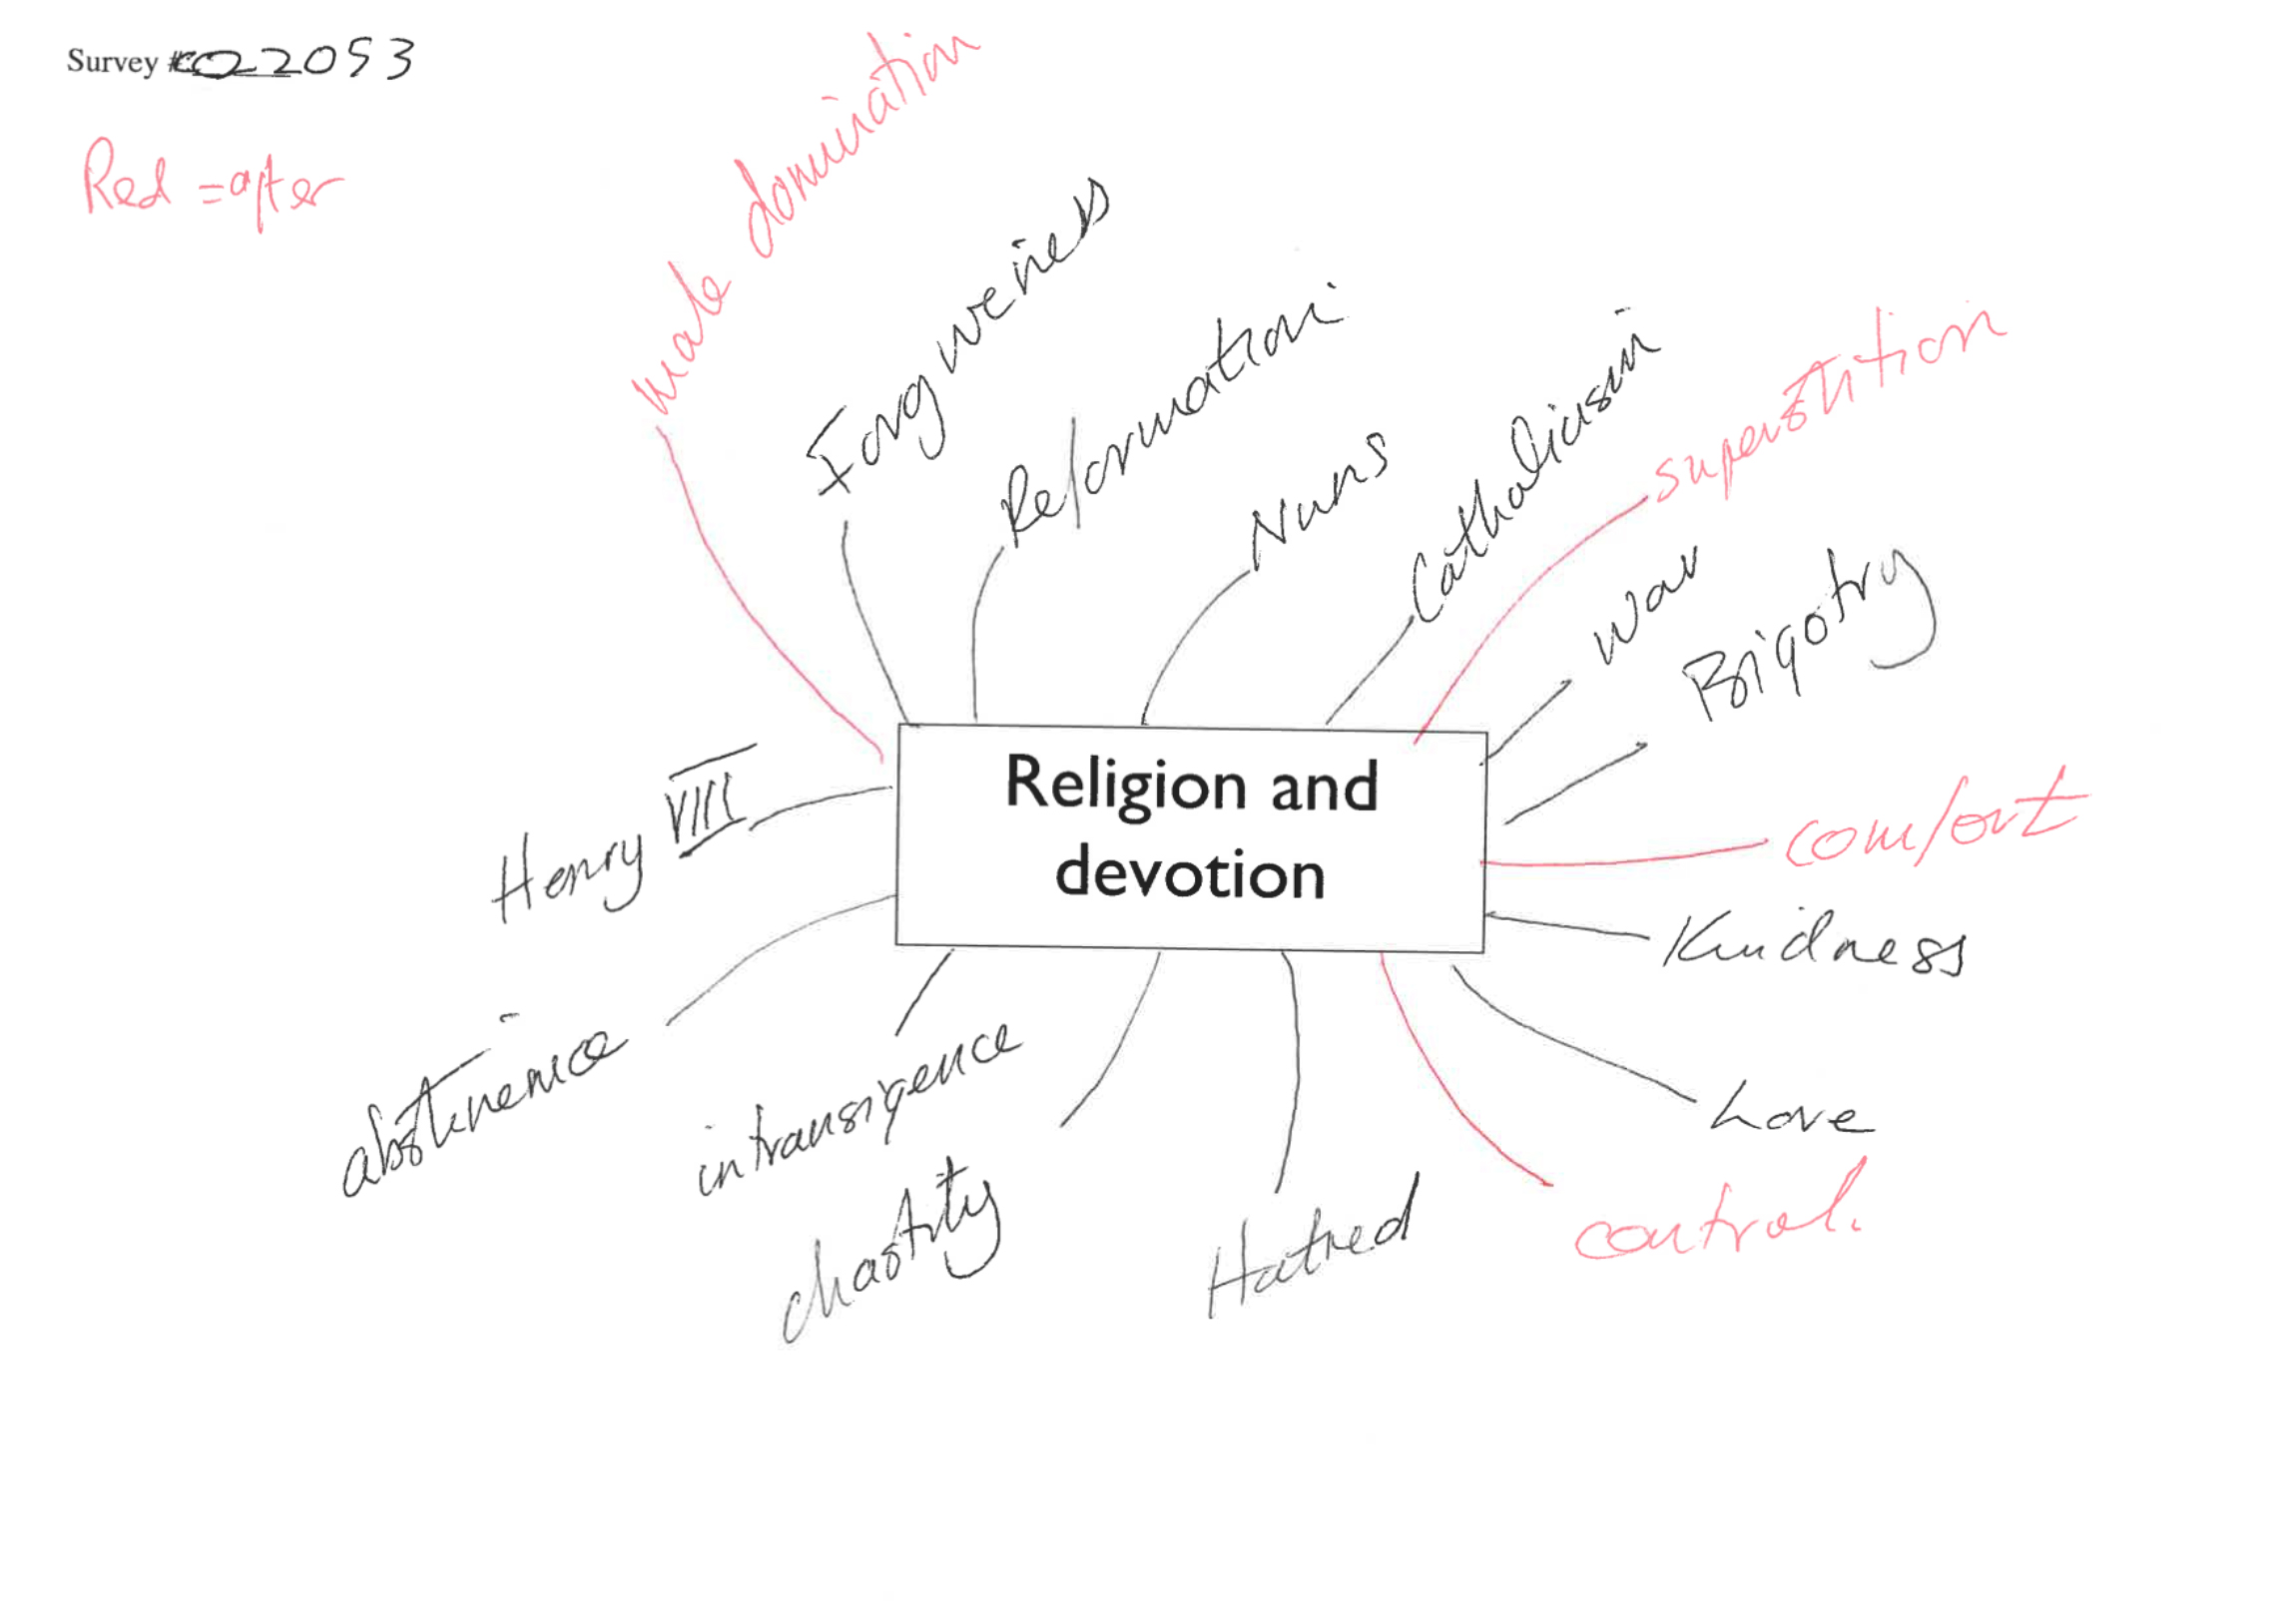
To complete a personal meaning map, a visitor is stopped before they go into an exhibition, display, or area. They are given a sheet of paper with a central concept, word or idea. The visitor writes down the thoughts they have relating to that central term. After they have been through the area that is being evaluated, they revisit the same sheet, adding new ideas, concepts or information, in a different colour pen. People can add ideas off the main idea, or as branches from another concept.
For the Madonnas and Miracles exhibition, the starting point was getting the right term to put in the centre of the meaning map. We did a pilot project with three of these ideas, and finally settled on the central idea of ‘religion and devotion’.
As always, the team of volunteers was brilliant and gave lots of really good feedback and were crucial to making this project work. They took some demographic information, and recorded how long visitor spent in the exhibition. We showed people an – unrelated – meaning map to start with to give them an idea of what to do.
In total, 17 meaning maps on the topic of were completed during the evaluation period. 10 were before and after.
The meaning maps did seem to show the impact the exhibition had on visitors. Before visiting the exhibition, the words used in relation to the central theme were mostly around religious actions and outputs. For example, prayer or praying was mentioned 7 times, worship twice, singing/music 3 times. 6 people added religious venues (church, temple, shrine or ‘inspiring buildings’). Words linked with group identity were fairly frequent written on the before maps, including community/communal (3), fellowship and togetherness.
There did seem to be a shift in language towards more domestic and everyday terms in the post-visit meaning maps. For example, one person added to their pre-visit comment of ‘offers hope for the future’ with ‘if families keep together’, demonstrating the shift towards a more personal and family-focussed view. None of these domestic phrases appeared in the pre-visit meaning maps. Themes of devotion and meditation only appeared in post-visit meaning maps.
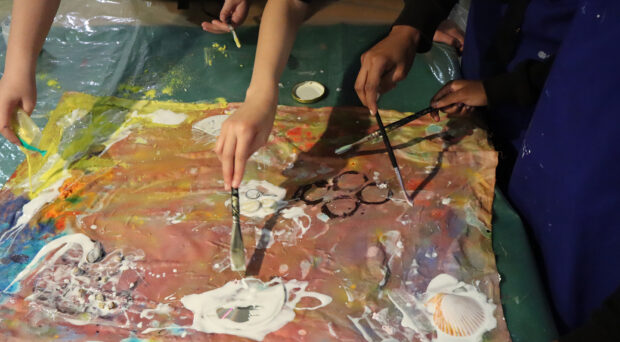
We have continued to use personal meaning mapping in evaluation, most recently on the Heritage Lottery Funded project Pacific Currents at the Museum of Archaeology and Anthropology – as reported on this blog. Here we are asking people to tell us what they know about the Pacific so that we can test out text and themes and to help us inform the new Pacific displays.
Meaning mapping is an interesting way to evaluate an exhibition. It is not as prescriptive as a questionnaire, with no tick boxes or ‘right’ answers, it allows visitors to be free in their comments. Although this project was relatively small, it really helped us to understand what visitors were getting out of the Madonnas and Miracles exhibition.
If you are approached by an eager volunteer at one of the University Museums to do a bit of meaning mapping, rest assured that the results do help us make our exhibitions better.